Marketing Innovative Products and Services

Fundamentals of marketing research
The marketing research is usually defined in terms of “collecting, analyzing, and reporting marketing information”[1], which can be used to make the marketing decisions, or solve marketing-related problems. Some companies, such as Google, have a reputation for data-driven, fact-based decision-making. In this organization, all employees are expected to ask relevant questions and make business decisions based on solid empirical data, rather than experience, ”hunch feelings”, etc. At Google, all marketing decisions should be backed by data “from the field” and all sorts of managers and their behavior are evaluated and compared by using the internally developed, data-backed models[2]. Such developments have led to the need to continuously monitor the marketing developments by gathering relevant marketing information and using it in decision-making and problem-solving. This approach is often called marketing intelligence and mostly matters in fast-paced industries, with constant fluctuations of consumer tastes, such as fashion.
A company often quoted as possessing an exemplary marketing orientation is the Spanish fashion retailer Zara, a part of the Inditex group, which owns a range of other successful European fashion brands, including Bershka, Massimo Dutti, Pull & Bear, Stradivarius. The company does not have a formal marketing department and specialized marketing staff, but rather infuses its marketing intelligence spirit into the culture of all employees. Everyone at Zara, as well as other Inditex companies, is expected to devote themselves to customer satisfaction and developing better marketing offers than the competitors. The company is notorious among its competitors for stocking new items almost on daily basis, based on data collected both by employees and the automated stocking and point-of-sale information systems. All information is constantly fed to Inditex design, purchase and production departments, which try to customize the products to the demands of the local customers. Managers of each of the Inditex brand stores is able to use the “Cassiopeia” information system to describe the most successful items in their store and demand specialized products to be shipped, even in relatively small quantities. Prices are also based on the locally collected information and adjusted to what the customers are actually willing to pay for a particular item. Then, the company seeks materials and manufacturing options, which still guarantee that the profit will be made on each item produced and shipped[3].
What is marketing orientation?
The Inditex case study shows that both an adequate employee culture, as well as marketing actions are required to achieve the continuous and successful marketing intelligence in an organization. Many different theories try to explain how to align those two with the requirements of marketing agility, but one of the most popular has been authored by the famous marketing researchers Ajay K. Kohli and Bernard J. Jaworski[4]. They have developed a theory of marketing orientation, which involves three distinct steps: collecting information from the market, making sure that it is shared among all departments within the organization and that the organization creates an appropriate response to the market challenges identified. The following figure illustrates this concept.
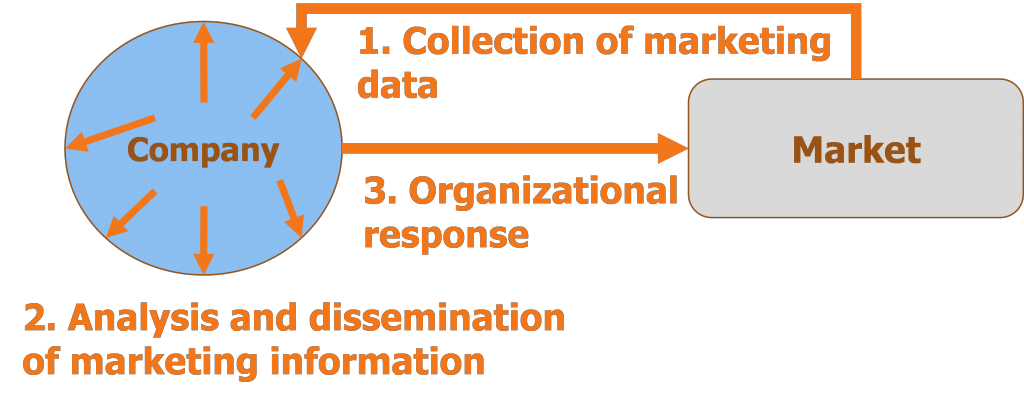
Figure 4. Marketing orientation (according to Kohli and Jaworski)
Created by authors and licensed under a Creative Commons Attribution-NonCommercial-ShareAlike 4.0 International License.
How should I perform marketing research?
There are several steps involved into performing a successful marketing research project and each of them revolves around a simple question, which involves one (or multiple) answers[5]. Those are:
- As implied by any research, a relevant research question should be identified in the first step. Good identification of the real problem is the most important part of the marketing research process, since it enables an organization to look for the real issues, instead of poking around symptoms (instead of addressing the underlying problem) and wasting time and money on flawed research initiatives. This stage is often difficult for aspiring entrepreneurs, who often “fall in love” with their idea and perceive it to be “the best thing since the sliced bread”, as the popular American proverb says. This is why one of the most important sources of entrepreneurial failure seems to be the overestimation of consumer demand, arising from a failure to look at the product/service from the customers’ point of view. This is why any business idea has to be analyzed by taking into account what the actual future customers really think about it. It is also useful to obtain some realistic market information as the basis for all fundamental marketing decisions.
- After the research question has been identified, the research approach needs to be addressed. The fundamental choice is based on the type of data to be collected, which involves both primary and secondary market data. While primary data needs to be collected from the actual (or potential) customers, the secondary data has been already collected and someone has, usually, even created an useful analysis and a report, which you can either obtain for free, or buy from a specialized company. For instance, one can download (for a fee, usually in the range from several hundred, up to several thousand US dollars), a range of market research reports from Web sites, such as http://www.marketresearchstore.com, http://www.reportlinker.com, or http://www.marketresearch.com. For a more comprehensive coverage of industry news and intelligence, one should turn to more specialized companies, which provide industry-specific intelligence. In the case of information technology, which is one of the most important fields for the fast growing start-up companies, the most important industry sources include the Gartner technology research and advisory company (http://www.gartner.com) and the International Data Corporation (IDC) market research company (https://www.idc.com).
Even without a lot of resources, potential entrepreneurs can use the general news sites and the Internet search engines, such as Google, to locate a lot of useful information for their ventures. Some useful free Internet tools for such a purpose include the Google Trends (https://www.google.com/trends), showing what the people are searching for on the Internet and the Google Correlate (https://www.google.com/trends/correlate), enabling you to explore potential relationships among Internet search trends and the real-world data.
Another potential problem, especially when using free Internet sources, might be related to the authenticity of the information, which could be published by an individual, without a lot of regard for the quality control, or checking the sources of a story. Naturally, if an information comes from a reputable news source, such as the well-known newspaper, or a TV network, its authenticity can be probably taken for granted, which is, certainly, not the case with the information downloaded from personal blogs, forums, tweets (i.e. short thoughts, published on Twitter), or updates from one’s Facebook page. Each Web site should be evaluated against the “reasonable” standards of unbiased reporting, while a group of independent Web sites, dedicated to “debunking” Internet myths and hoaxes (http://www.snopes.com; http://www.factcheck.org) can be consulted, as well. In order to check for the authenticity of images, a keyword-search of all images, publicly available on the Internet, is available at the Google Image Web service (https://images.google.com). It is also possible to upload an image file to be checked, as well, either by using specialized Web sites, such as TinEye.com, or the general Google Image service (https://www.google.com/intl/es419/insidesearch/features/images/searchbyimage.html).
The collection of primary data involves several potential research approaches. Those may include[6]: observation of actual consumers and their behavior, running consumer surveys, or even creating experiments, trying to make connections among different marketing decisions and their potential outcomes. Regardless of the research design choice, one also needs to choose among different methods of approaching consumers and asking for data. Traditionally, data had been collected by the research staff, approaching the research participants for a face-to-face interview, or questionnaires, which could be sent by postal mail, or arranged over the phone. The contemporary research increasingly relies on the online contact, with several Web sites, offering free survey creation tools (alongside more powerful and paid survey options). One of the leading online survey providers is the SurveyMonkey (https://www.surveymonkey.com), although the usability of its free version is somewhat limited by the limitation of accepting only 10 questions and 100 responses. Alternatives, such as the SurveyPlanet (https://surveyplanet.com) come without limitations, while more technically oriented tools, including the free Google Forms (https://docs.google.com/forms), enable the researchers to create complex Web surveys, store their data on the cloud-based service, analyze it online and export for analysis in specialized software packages.
Still, the potential entrepreneurs, who do not wish, or do not have the means to pay for the professional research service, will need to “stock up”, or refresh their knowledge from the college methodology course. This can be done by signing up for one of the available free Massive Open Online Courses (MOOCs), offered by some of the world’s leading universities. At the time of the writing of this book, one of such most popular courses is run at the Coursera Web site, by the University of Michigan staff[7]. The alternative MOOC courses can always be checked at sites, such as the https://www.mooc-list.com, or can be purchased from individual trainers, on e-learning marketplaces, including Udemy (http://www.udemy.com), or the subscription-based e-learning providers (e.g., Lynda.com, or the Skillshare.com).
Alternatives to surveys, in the “data-collecting department”, include the in-depth interviews, which belong to the exploratory research techniques. They are conducted by asking open-ended questions and providing participants with an opportunity to voice their experiences and personal stories, related to the products and the way they use them, feel about them, etc. While this is a useful way to understand an individual consumer, more insights can be obtained from another exploratory research method, usually referred to as the focus group. It consists of a group of consumers (or potential consumers) of a product, or a service, who are asked to share their thoughts and experiences on a relevant marketing research topic. The meeting is facilitated by a research professional, who runs an agenda and creates a structure for the conversation. Outputs of the exploratory research techniques usually include detailed transcripts, which are analyzed by using specific behavior, or thought patterns and interpreting them.
- The population and the sample for a research project need to be identified in the following step. The population studied consists of all existing and potential consumers of a product/service (i.e. all members of the “target group/market”). Nevertheless, it is not easy to identify all the people belonging to such a group, as there should be a practical list of accessible research participants, usually referred to as the sampling frame. This may be a public list of telephone subscribers, an internal mailing list, belonging to a company, a marketing list purchased from a specialized marketing agency, etc. There are two fundamental ways of choosing a certain amount of consumers from the sampling frame (i.e., the sample), in order to run the primary data collection and make the conclusions, which will be tested at the population level by using the statistical analysis (which you, hopefully, remember from your college classes, or could learn from a MOOC course[8], or some other e-learning offering).
You may ask yourself: why complicate and use the statistics? Well, the answer is simple: it’s all about the costs and benefits. It would be fairly easy to approach all the potential consumers (provided that you have obtained the sampling frame). Nevertheless, this would be, in most cases, prohibitively expensive and would provide only very low benefits, in comparison to a much cheaper study, in which a systematic and scientific approach to sampling has been used.
The convenience sample is the easiest way to draw up the participants for a simple study: in this case, you would enlist as many participants as possible, based on their availability, either on a certain site, such as the shopping mall; at home, while being contacted by phone; on the Internet, as approached on a social network, or a chat site, etc. Nevertheless, no one can guarantee that the research participants really represent the population and its “real” characteristics. For instance, if researcher(s) wish to establish the market attractiveness for a company, specializing in big-size shoes, with a convenience sample, they will never know if influx of people with “non-standard” feet is really a sign of an attractive market, or just a result of pure chance. At the other hand, the probability (random) sample presupposes that the researcher(s) possess the sampling frame (i.e. a list with the names of all potential research participants) and will use a scientific method to choose the desired number of names from the list. Such a method should provide the same chance to all list members to be selected as research participants. Although the actual response rate will be always lower than the planned number of participants (since some of them are not ready to provide any data), the probability sampling approach guarantees that the statistical methods actually work on the data collected. This means that the researcher(s) will be able to tell, by using a certain level of probability, that the data patterns, obtained on a sample, can be used on the entire population of customers, from which this sample has been drawn.
- After collecting the primary data, those have to be prepared for computer analysis (e.g. the duplicate entries and other obvious mistakes need to be removed/corrected, while non-completed surveys may be tolerated, removed, or subjected to statistical techniques for data approximation). The data analysis is, today, routinely performed on personal computers, by using the commercial spreadsheet software, such as Microsoft Excel (https://products.office.com/en/excel), or its open-source alternative Libre Office (http://www.libreoffice.org). However powerful, the spreadsheet software packages provide only a fraction of statistical capabilities, offered by the specialized research packages, including the most popular one for social science – PASW (http://www.ibm.com/analytics/us/en/technology/spss; previously called the Statistical Package for Social Science – SPSS), which is now offered by IBM. Although a limited trial version might be useful for some cash-strapped entrepreneurs[9], an open-source software package with some basic statistical functionality is available, as well (https://www.gnu.org/software/pspp)[10].
- The last is fairly logical, since the researcher(s) need to report to their clients about the findings of the study conducted and, usually, provide the conclusions and managerial recommendations. If you are doing the research for yourself, you probably won’t write a formal research report (unless you are required to do so for a grade on a university course, such as this one), but will still need to go through your results and evaluate them.
STUDENT ACTIVITY:
Take a look at the following You Tube video, which is a part of the comprehensive series of free training for small business owners:
https://www.youtube.com/watch?v=aHqoDAGHko4
Before looking at the video, think about the content of your marketing research, i.e. of what should be found out by research and how the research should be done and note your comments. Compare your comments to those, which you can find in the video. Were you right? In how many cases?
RELATED WORKSHEETS:
After you go through and fully understand the topic(s) covered so far, you should be able to fill in the worksheet 1B.
[1] Source: Saylor.org academy: Principles of Marketing open education resource, http://www.saylor.org/site/textbooks/Principles%20of%20Marketing.pdf, p. 305.
[2] Source: Garvin, D. A.: How Google Sold Its Engineers on Management, Harvard Business Review, December 2013, https://hbr.org/2013/12/how-google-sold-its-engineers-on-management
[3] Source: Andrés Mazaira E. González Ruth Avendaño, The role of market orientation on company performance through the development of sustainable competitive advantage: the Inditex-Zara case, Marketing Intelligence & Planning, Vol. 21 Iss 4, 2003, pp. 220 – 229
[4] Source: Kohli, A.K. & Jaworski, B.J. Market Orientation: The Construct, Research Propositions, and Managerial Implications, The Journal of Marketing, 54(2), 1990, pp. 1-18.
[5] Source: Saylor.org academy: Principles of Marketing open education resource, http://www.saylor.org/site/textbooks/Principles%20of%20Marketing.pdf, p. 322.
[6] Source: Armstrong, G., Kotler, P.: Marketing: An Introduction, 12th Ed (Global Edition), Pearson Education, 2015, pp. 135-144.
[7] https://www.coursera.org/learn/questionnaire-design
[8] You can try one of the courses, offered by the MOOC site Coursera (https://www.coursera.org/learn/statistical-inference, or https://www.coursera.org/learn/business-statistics), or a similar Web site, called EdX (https://www.edx.org/course/data-analysis-take-it-max-delftx-ex101x-0). Some free and open online courses from individual university Web sites, including Stanford Lagunita (https://lagunita.stanford.edu/courses/OLI/ProbStat/Open/about, https://lagunita.stanford.edu/courses/OLI/StatReasoning/Open/about) may be useful, as well.
[9] http://www.ibm.com/analytics/us/en/technology/spss/spss-trials.html
[10] The PSPP package is simple to use, featuring a graphical user interface, similar to one, offered by the SPSS/PASW software, but it has only a very limited set of statistical functionalities. The „professional“ statistical analysis package, developed and offered for free by the academic community, simply called R (https://www.r-project.org), is immensely more powerful, but quite difficult to use, since it requires the use of commands and a certain level of programming knowledge. Simplified, user-friendly approaches to using the R package have been developed: they include the free „graphical user interfaces“, which use the simple menus, similar to those, found in SPSS/PASW. The most popular are the R Commander (http://socserv.mcmaster.ca/jfox/Misc/Rcmdr) and the Deducer (http://www.deducer.org/pmwiki/index.php?n=Main.DeducerManual).
Introduction to the module
In this module participants look at the steps taken to market products and services. They will work on real cases involving new products or services.
Download here RELATED WORKSHEETS
The workbook in this course please submit to ljiljana.najev.cacija@efst.hr (UNIST students), s.best@mdx.ac.uk (MDX students), apenafiel@uma.es (UMA students), upon finishing the assignments.
About authors
Nikša Alfirević is a full professor of Management and an assistant professor of Sociology at University of Split, Croatia. He holds a PhD in Management from the University of Split (Croatia) and a PhD in Sociology from the University of Klagenfurt (Austria). He has developed the Student Business Academy program as a form of student entrepreneurship learning, which served as a foundation found for the SBeA project.
Daša Dragnić is an assistant professor of marketing at the University of Split, Croatia. She has extensive experience in developing programs for entrepreneurial education, consulting small businesses and developing small business policies at the municipal level.
Ljiljana Najev Čačija is an assistant professor of marketing at the University of Split, Croatia. She is also an entrepreneur and a consultant, specialized in small business development and nonprofit organizations strategy and marketing.
For discussion and course related questions visit the FORUM.
Course Features
- Lectures 7
- Quizzes 0
- Duration 60 hours
- Skill level All levels
- Language English
- Students 17
- Assessments Self
-
UNIT 1
-
UNIT 2
- Lecture 2.1 Analyzing the marketing environment
-
UNIT 3
- Lecture 3.1 Fundamentals of marketing research
-
UNIT 4
-
UNIT 5
- Lecture 5.1 Planning the marketing mix
-
UNIT 6
- Lecture 6.1 Products, services, and brands
-
UNIT 7
- Lecture 7.1 New product development (NPD)


